Icinga Status
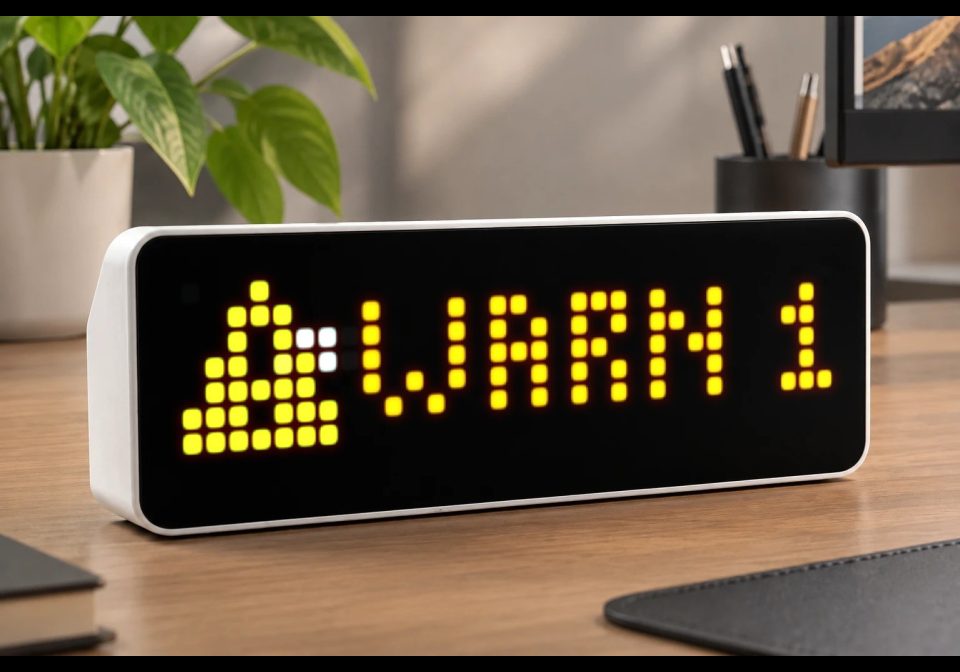
On your display
Shows OK, WARN or CRIT from Icinga
- Topic
- Miscellaneous
- Includes
- Script · 3 icons
Runs on
- Runs on 32×8 (TC001 & DIY)
- Runs on 52×16 (TC002)
- Does not run on 32×8 with AWTRIX 3 (TC001 & DIY) Made for AWTRIX NG.
Choose your display in the next step.
Script description
Displays the global Icinga status directly on AWTRIX NG without Home Assistant or MQTT.
The script queries the Icinga 2 CIB status API via HTTPS and displays:
🟢 OK – no host or service problems
🟡 WARN n – warning or unknown services
🔴 CRIT n – down hosts or critical services
Requires an Icinga API user with access to /v1/status/CIB.
HTTP Basic Authentication must be entered as a complete Authorization header:
Basic <base64(username:password)>
Example to generate it on macOS/Linux:
printf '%s' 'username:password' | base64
Recommended LaMetric icons for Awtrix, Awtrix NG should install automatically:
649 = OK, 1077 = warning, 555 = critical.
Press the middle/select button to force an immediate refresh.
Sign in to view and copy the code of this script.
Discussion 0
Ask a question, suggest a change or share how you use it.
No comments yet. Start the conversation.
More scripts in Miscellaneous
Something wrong with this script? Report it.
Have an idea?
Sign in to ask questions and join the conversation.