EVCC Energy Dashboard
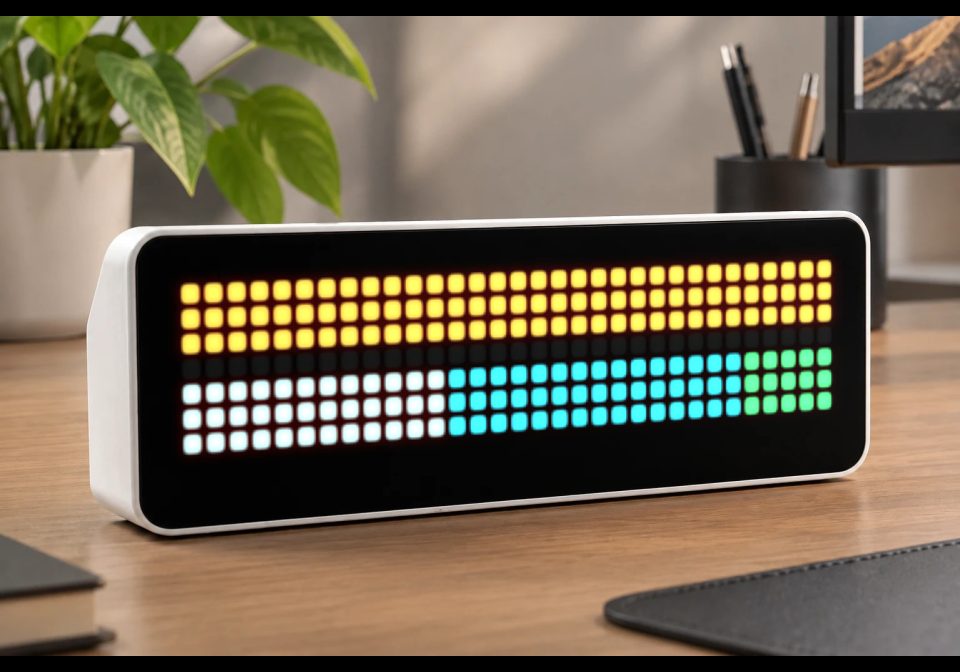
On your display
Live energy balance from EVCC
- Topic
- Smarthome
- Includes
- Script
Runs on
- Runs on 32×8 (TC001 & DIY)
- Runs on 52×16 (TC002)
- Does not run on 32×8 with AWTRIX 3 (TC001 & DIY) Made for AWTRIX NG.
Choose your display in the next step.
Script description
NOTE: This screen requires an EVCC.io setup configured to use the same MQTT server as your AWTRIX NG device.
Energy balance
This screen gives you a live overview of where your energy is coming from and where it is going.
The top bar represents your current energy sources:
- 🟠 Amber — Solar production
- 🔵 Cyan — Battery discharging
- 🔴 Red — Grid import
The bottom bar represents where the energy is being used:
- ⚪ White — Home consumption
- 🟣 Violet — EV charging
- 🔵 Cyan — Battery charging
- 🟢 Green — Grid export
Both bars always fill the full width of the display. Each segment is therefore proportional to the current power flow: a larger segment means that source or consumer represents a larger share of the total power at that moment.
EV battery indicator
The bottom line represents the car's battery level.
It stays empty when no car is connected to the charger and lights up violet while the car is charging.
Only real power flows are shown
The visualization only displays energy that is actually flowing right now.
For example, if the car isn't charging, there is no violet EV segment. If there is no grid import or export, no red or green grid segment is shown. The display deliberately avoids arrows or other indicators that could suggest an energy flow that isn't actually happening.
More EVCC details
Press the button to cycle through the available EVCC datapoints and view more detailed information about your energy system, charger, and vehicle.
More information about EVCC can be found at evcc.io.
Sign in to view and copy the code of this script.
Discussion 0
Ask a question, suggest a change or share how you use it.
No comments yet. Start the conversation.
Have an idea?
Sign in to ask questions and join the conversation.