Network Monitor (TCP/HTTP)
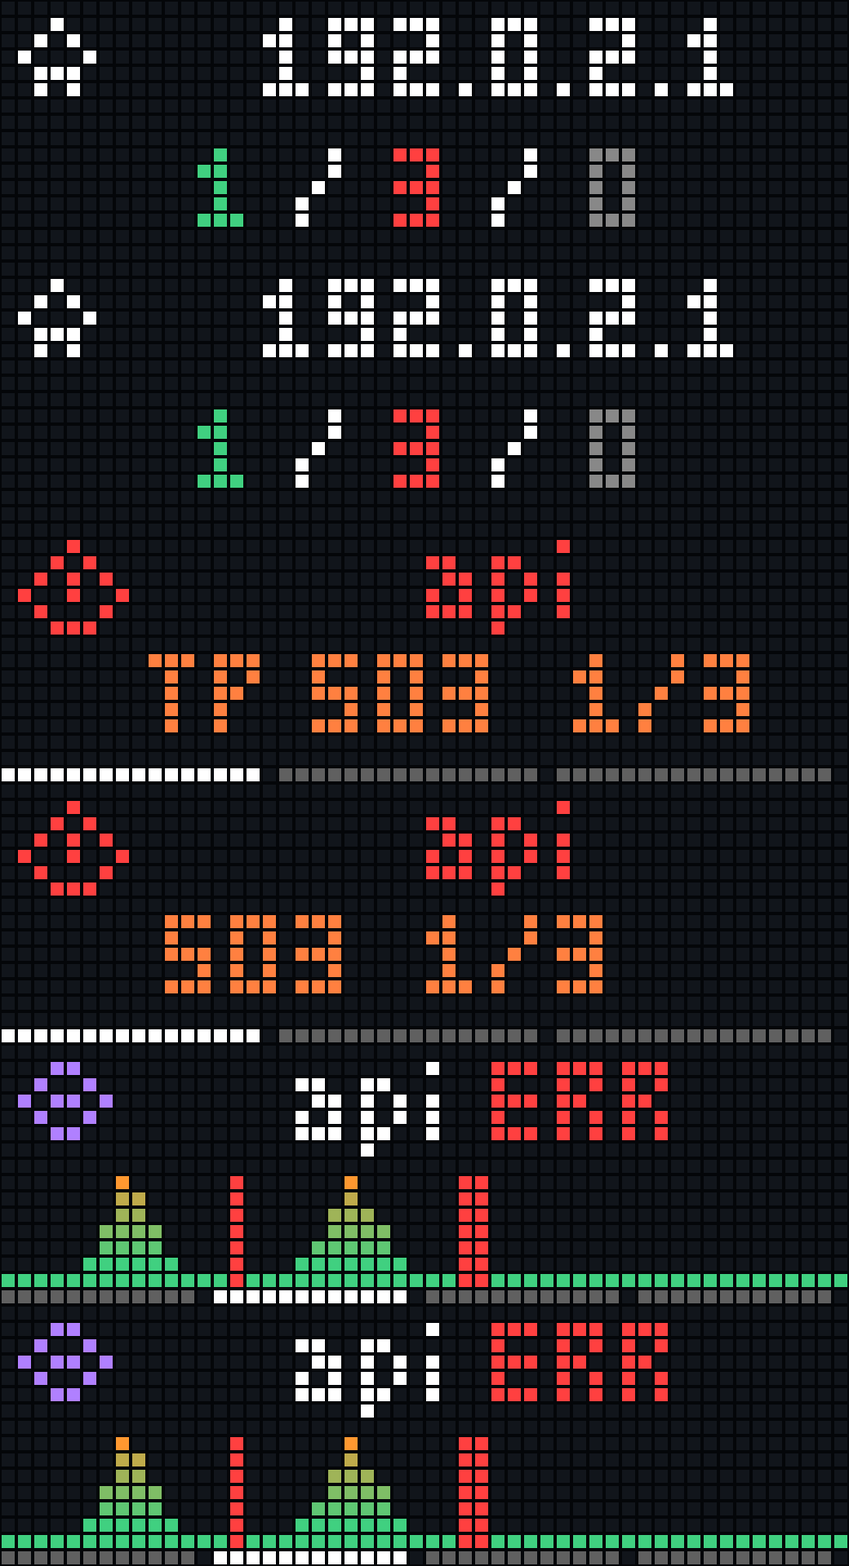

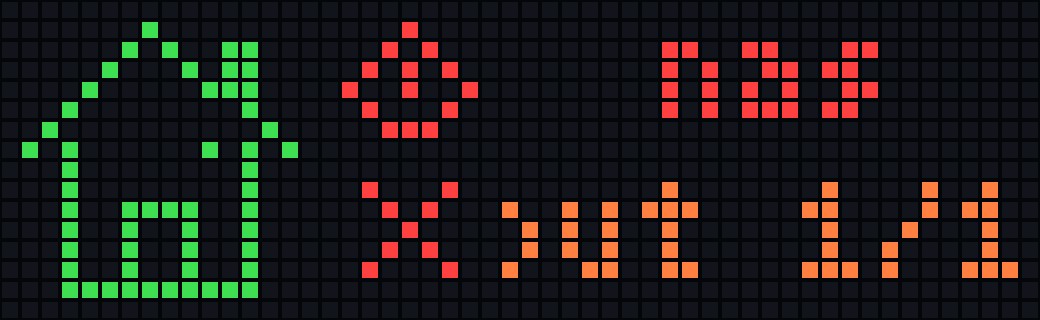
On your display
Performs periodical TCP or HTTP checks for list of hosts or urls.
- Topic
- Miscellaneous
- Includes
- Script
Runs on
- Does not run on 32×8 (TC001 & DIY) Needs an AWTRIX that talks TCP.
- Runs on 52×16 (TC002)
- Does not run on 32×8 with AWTRIX 3 (TC001 & DIY) Made for AWTRIX NG.
Choose your display in the next step.
Script description
Network Monitor (TCP/HTTP)
Keep an eye on your network from your AWTRIX NG clock. NetworkMonitor checks TCP services and HTTP endpoints, shows your public IP address, and cycles through a network overview, active failures, and per-host response history.
Platform: Ulanzi TC002 · Display: 52 × 16 · Version: 0.31
Authors: Dr-Dream / ChatGPT / Codex
GitHub: Dr-Dream/AwtrixNetworkMonitor
Features
- Separate, comma-separated lists for TCP services and HTTP/HTTPS URLs.
- Public IPv4/IPv6 address retrieval through
http://ifconfig.meby default. - Three pages: HOME, ALERTS, and NODES.
- Colored results, failure reasons, response times, and a rolling history graph.
- Relative green-to-orange history: stable responses stay green, large increases turn orange, and failed checks remain red.
- Automatic page rotation or manual navigation with the knob.
- Optional animated instance icons: house, VPN shield, server, WiFi, database, and cloud.
- Configurable colors, intervals, timeouts, scrolling, and page timing.
- Background checks continue while another app is displayed. No external icon downloads are required.
Screens
The diagrams below explain the layout; they are not exact pixel or font reproductions. Long labels scroll inside their own text area. Page names such as HOME are documentation labels, not additional titles drawn on the clock.
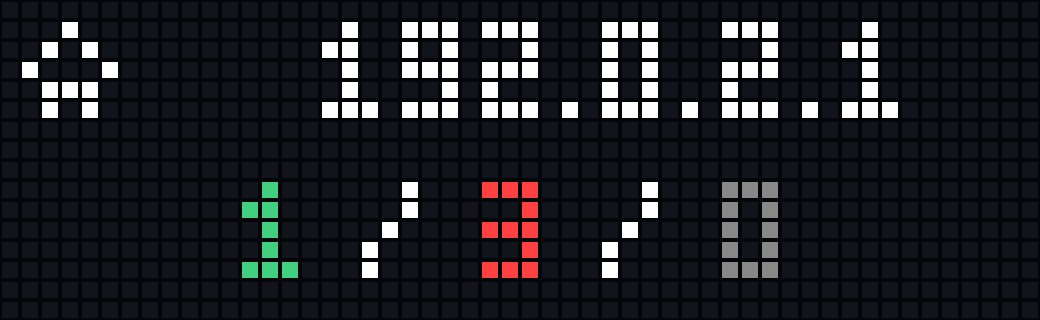
HOME — network overview
+--------------------------------------------------+
| [house]  203.0.113.42                             |
|          8 / 1 / 2                               |
+--------------------------------------------------+
           OK  FAIL WAIT
The upper line shows the public IP address beside the small HOME pictogram. The lower line shows counts of successful, failed, and pending TCP/HTTP targets, in that order. Public IP status is separate from these counts.
- Before the first valid IP:
..., or!after a failed request. - After a failed refresh: the last valid address followed by
!. - While refreshing a known address: the address followed by
....
The lower counters use the full available interface width; their indentation above only makes the diagram easier to read.
ALERTS — what needs attention
+--------------------------------------------------+
| [alert]  https://example.com/health                |
|   [X]    HTTP 503  1/2                            |
+--------------------------------------------------+
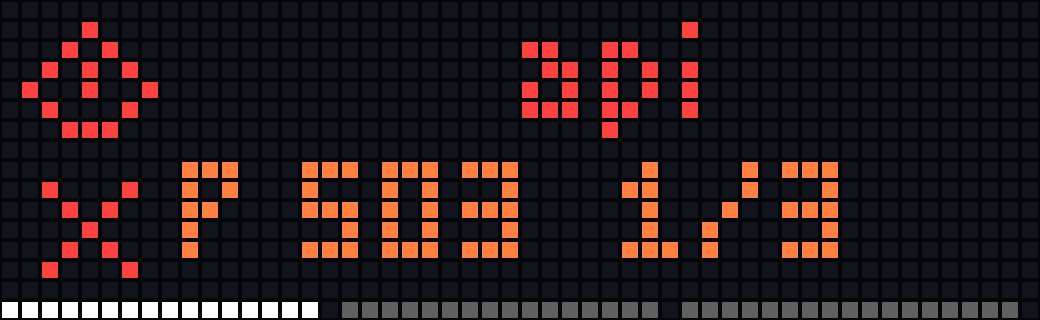
An optional bottom-row indicator shows the current alert in white and other active failures in gray. Its positions refer only to failed targets, in alert order. It uses the same spacing and colors as the NODES indicator, and is enabled by default through Show page indicators. With just one failure, the indicator is hidden and the original text position is retained. The second text line moves up one pixel while the indicator is visible.
Only failed targets appear here. The first line shows the target; the second shows the failure reason and its position in the failure list. The upper pictogram and lower cross identify an alert; the cross pulses. The page is skipped when there are no failed targets.
Examples of failure reasons include HTTP 503, Network error, timeout, refused, and dns; TCP reason strings come from the firmware.
NODES — individual targets and history
+--------------------------------------------------+
| [TCP]  example.com:443  42ms                      |
|        .  : . | :  . : | .                       |
+--------------------------------------------------+
         older --------------------------> newer
The upper line shows a small TCP or HTTP pictogram, the target, and its result in one scrolling line. A successful result is a time in milliseconds; ERR means failure, and -- means no completed result yet. A trailing ... marks a check in progress while the last completed result remains visible.
The graph fills the lower half of the available interface area:
- One completed check occupies one pixel column.
- Successful bars use a green-to-orange vertical gradient relative to the minimum successful response time in each node’s retained history. Stable values stay green; small fluctuations receive a slight tint, and substantial increases move toward orange. Falling values become greener again. Full orange increase (100% by default) sets the minimum relative growth needed to reach orange; when the observed range is larger, its maximum becomes the orange endpoint. Bar heights scale to the largest successful response time in the retained history.
- Failed checks are full-height red bars.
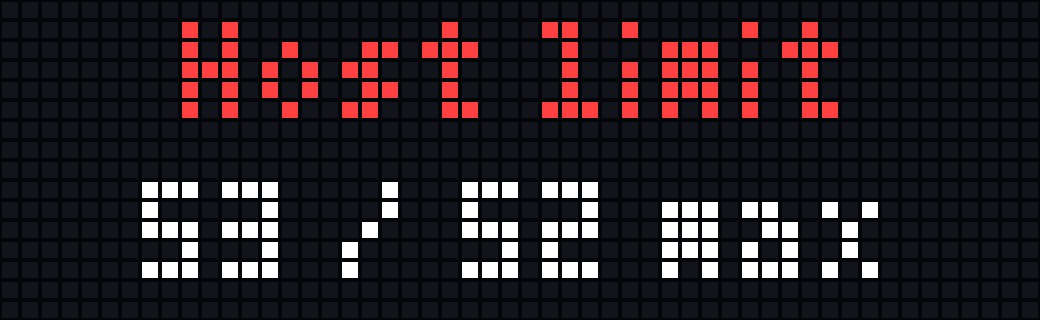
- An optional bottom-row host indicator highlights the current host in white and the others in gray. Slots are distributed evenly across the available interface width, with small gaps where space permits. Each host has its own slot, up to one host per pixel. The combined TCP + HTTP target count must not exceed the available content width (52 without an instance icon; 36 with default icon geometry on TC002). Excess targets reject the entire list and show a Host limit message; checks remain paused until the configuration is corrected. With just one host, the indicator is hidden and the graph keeps its full height. The graph reserves one row only while the indicator is visible. Disable Show page indicators to restore the full graph height.
- Oldest samples appear on the left; newest samples appear on the right. Once full, the graph drops the oldest sample.
- With no samples, a dim baseline is shown. With no configured targets, the page displays
--and0 targets.
The graph is drawn directly below the header across the full available width; the sketch uses punctuation only to suggest bars.
Relative response history
Earlier actual device captures of the gradient, before the position row was added, with synthetic data. Colors compare successful response times within each node’s retained history, rather than using fixed millisecond thresholds.
| Stable 5 ms | Small 5–6 ms variation | Large 5–50 ms changes |
|---|---|---|
Optional instance icon
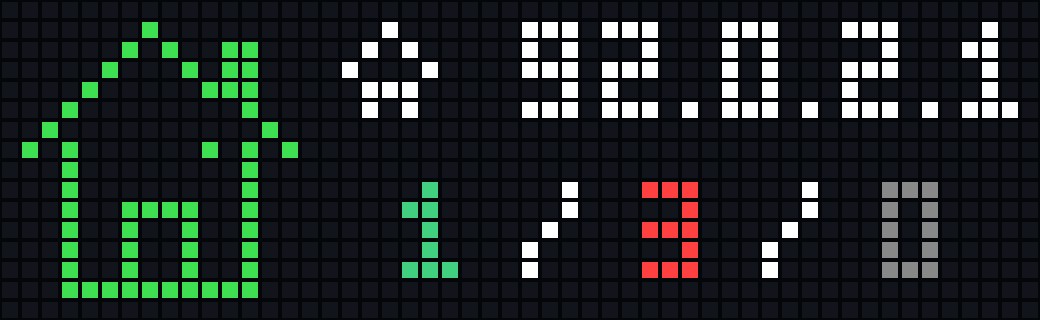
Use different icons and colors to distinguish multiple installed copies, such as home, office, and VPN monitoring.
+--------------+-----------------------------------+
|              | [page]  target or public IP        |
|   INSTANCE   |                                   |
|     ICON     | counters, failure reason or graph  |
|              |                                   |
+--------------+-----------------------------------+
The large icon stays on the left on every page. All original page/protocol pictograms remain visible to its right. On TC002, the default icon area is 14 × 14 pixels, with a one-pixel left margin, a one-pixel gap before the interface, and vertical centering. Disabling the icon restores the original full-width layout.
Available choices: home, shield (VPN), server, wifi, database, and cloud. These identify the script instance; choosing a shield does not add a VPN check.

Controls and page rotation
| Control / mode | Behavior |
|---|---|
| Middle/select button | Requests a new node scan and public IP refresh after the current operation finishes. |
auto mode |
HOME → ALERTS if needed → NODES if enabled → next app in the device rotation. |
manual mode |
Turn the knob left or right to change pages. Entries within a page still advance automatically. |
Each entry stays for at least Minimum entry duration. Long text gets time to scroll, bounded by Scroll wait limit. In automatic mode, NetworkMonitor holds the app rotation while it shows its entries. A long target list can therefore take considerably longer than one page duration.
Quick setup
- Install NetworkMonitor from AWTRIX Hub, or add the complete
NetworkMonitor.axsource in the web interface's Scripts tab. - Open Apps → your installed script → gear.
- Set TCP hosts and/or HTTP URLs independently. Both lists are empty by default.
- Optionally enable an instance icon and choose its shape and color.
- Save. The app restarts and begins collecting fresh results.
Example TCP hosts:
192.168.1.1:80,example.com:443,nas.local:445
Example HTTP URLs:
https://example.com/health,http://192.168.1.10:8080/status
Spaces around entries are allowed. TCP entries require an explicit port from 1 to 65535. HTTP entries require a complete http:// or https:// URL. Encode commas within URLs as %2C. Invalid entries are skipped and logged.
To monitor separate groups, install the source under different script names and configure each copy independently.
Configuration
All settings are available in the app's gear menu. Defaults below apply to a new installation; updates preserve existing saved values. Saving settings restarts the app and clears collected results and history.
Monitoring
| Setting | Default | Description |
|---|---|---|
TCP hosts (tcphosts) |
Empty | Comma-separated host:port entries; maximum 256 characters. A successful connection means OK; it is closed immediately. |
HTTP URLs (httphosts) |
Empty | Comma-separated complete URLs; maximum 512 characters. Final HTTP status 200–299 means OK. Response content is not checked. |
Public IP URL (ipurl) |
http://ifconfig.me |
Endpoint returning only an IPv4/IPv6 address, with optional surrounding whitespace; maximum 256 characters. |
Check interval (interval) |
60 s | Delay after a complete node scan finishes; 30–600 s. |
Public IP refresh (wanperiod) |
300 s | Delay after a public IP request completes; 60–3600 s. |
TCP timeout (tcp_timeout) |
4 s | Connection timeout; 1–30 s. |
HTTP timeout (http_timeout) |
5 s | HTTP request timeout; 1–30 s. Firmware queueing and DNS have additional limits. |
Show NODES page (show_nodes) |
On | Include per-target results and history in the page sequence. |
Display
| Setting | Default | Description |
|---|---|---|
Page mode (mode) |
auto |
auto or manual; see controls above. |
Minimum entry duration (pagetime) |
5 s | Minimum time for HOME or one target entry, not an entire target list; 2–30 s. |
Scroll wait limit (scrollwait) |
60 s | Maximum wait per entry; 10–180 s. The effective limit is at least the minimum entry duration. |
Show page indicators (node_indicator) |
On | Show evenly spaced position marks in the bottom row of NODES and ALERTS when the page has at least two items. Enabled by default. |
Active position indicator (color_node_active) |
#FFFFFF |
Current host or alert mark. |
Other position indicators (color_node_idle) |
#606060 |
Other host or alert marks. |
Graph gradient (graph_gradient) |
On | Green-to-orange vertical gradient for successful history bars. Off uses a solid Success color. |
Full orange increase (graph_full_pct) |
100% | Minimum increase above the retained successful minimum needed for full orange; 10–1000%. Larger values soften the color change. |
Scroll speed (scrollspeed) |
65% | Scrolling speed; 10–300%. Firmware base speed at 100% is 21 pixels/s. |
Scroll gap (scrollgap) |
10 px | Gap between scrolling repeats; 0–100 px. |
Scroll start delay (scrollhold) |
500 ms | Pause before scrolling begins; 0–5000 ms. |
Hold after knob input (manualhold) |
20 s | Hold after the last manual knob turn; 10–180 s. When it expires, the device advances to the next app. |
Manual display duration (manualtime) |
30 s | Normal app dwell time in manual mode before knob interaction; 5–180 s. |
Icon
| Setting | Default | Description |
|---|---|---|
Show instance icon (show_icon) |
Off | Add the large identifier to the left of every page. |
Instance icon (icon_kind) |
home |
home, shield, server, wifi, database, or cloud. |
Icon color (icon_color) |
#40B8E0 |
Independent of check status and the smaller pictogram colors. |
Animate icon (icon_animate) |
On | Animate icon details; WiFi pulses wave brightness and the cloud moves gently. Off keeps a static symbol. |
Icon left margin (icon_left) |
1 px | Blank space before the large icon; 1–4 px. |
Icon inset (icon_inset) |
1 px | Vertical inset on each edge; 0–2 px. TC002 sizes: 16 × 16 at 0, 14 × 14 at 1, 12 × 12 at 2. |
Animation frame duration (icon_step) |
350 ms | Duration of one of four animation phases; 100–2000 ms. |
The history capacity follows the remaining interface width: 52 samples per target without an instance icon, or 36 with default icon settings. Changing margins or icon size also changes that capacity.
Colors
| Setting | Default | Used for |
|---|---|---|
Slow graph color (color_graph_top) |
#FF9830 |
Gradient color at and above Orange response time. The low-latency endpoint uses Success. |
Success (color_ok) |
#40D080 |
Successful results, active OK count, and successful history bars. |
Failure (color_fail) |
#FF4040 |
Failed results, alerts, active failure count, and failed history bars. |
Pending (color_wait) |
#FFD040 |
Pending results and active pending count. |
TCP icon and activity (color_info) |
#40B8E0 |
TCP pictogram, activity indicator, and public IP refresh state. |
HTTP icon (color_http) |
#B080FF |
HTTP pictogram on NODES. |
Text (color_text) |
#FFFFFF |
Normal target text, public IP text, and counter separators. |
Inactive status (color_dim) |
#888888 |
Zero counters and inactive status. |
Failure reason (color_reason) |
#FF8040 |
Failure details on ALERTS. |
Empty history (color_empty) |
#404040 |
Baseline before a target has history samples. |
Compatibility and check behavior
NetworkMonitor requires AWTRIX NG on TC002, including the tcp scripting capability. It does not target AWTRIX 3 or ESP32-based TC001 firmware.
TCP checks test whether a connection can be established. HTTP checks test the final HTTP status and follow redirects according to firmware rules. Displayed times include request processing and queueing; they are not ICMP ping measurements. Checks run sequentially, with no automatic retries within a scan. Public IP retrieval is separate from node status and takes priority when due.
No API key or external icon pack is required. Do not include passwords or tokens in monitored URLs: URLs appear on screen and in logs.
Version 0.27 was compiled and run on TC002 with AWTRIX NG 1.2.3; all six instance icons were checked through the framebuffer. The 0.31 rendering methods were compiled and captured in a synthetic device demo, including ALERTS and NODES indicators with and without an instance icon. Boundary tests accepted 52 targets and rejected 53 without an icon. These tests do not cover every network failure mode, firmware version or deployment of the full revised app.
Complete source: NetworkMonitor.ax. Implementation details: architecture.
Sign in to view and copy the code of this script.
Discussion 0
Ask a question, suggest a change or share how you use it.
No comments yet. Start the conversation.
More scripts in Miscellaneous
Something wrong with this script? Report it.
Have an idea?
Sign in to ask questions and join the conversation.