ScriptAWTRIX NG
Solar Status
On an AWTRIX display
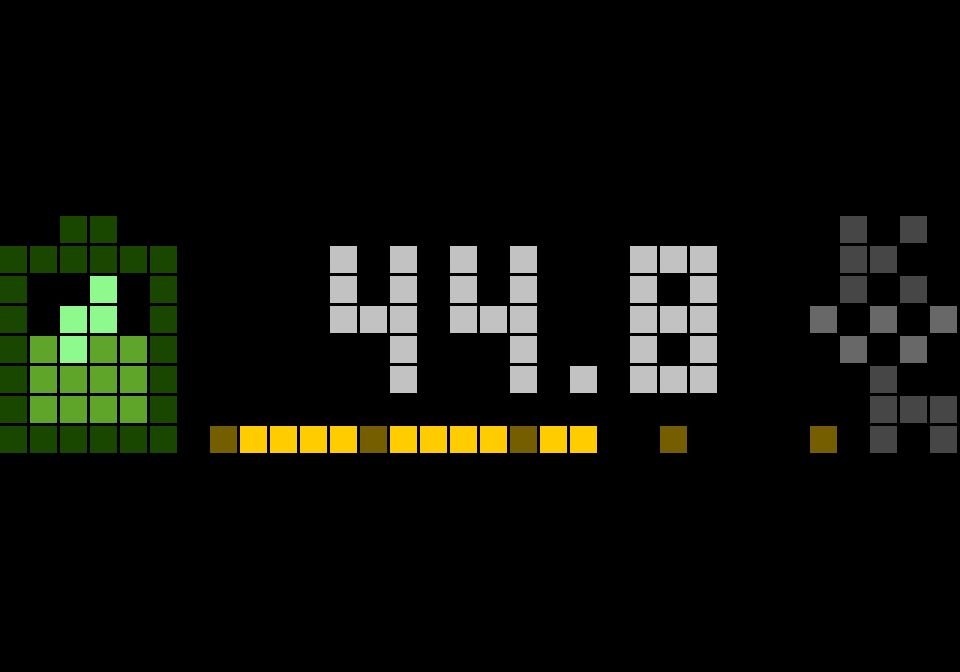
On your display
solar dashboard showing battery SOC (with status indicators), current generated power via a bottom progress bar, and daily energy yields
Which AWTRIX do you have?
See below where it runs, or choose your device.
- Topic
- Smarthome
- Includes
- Script
Runs on
- Runs on 32×8 (TC001 & DIY)
- Runs on 52×16 (TC002)
- Does not run on 32×8 with AWTRIX 3 (TC001 & DIY) Made for AWTRIX NG.
Choose your display in the next step.
Script description
⚠️ Crucial Prerequisite
This application DOES NOT connect to MQTT directly. It is part of a split-architecture layout to save ESP32 memory. It strictly REQUIRES the MQTT Collector background script to be installed and running on your AWTRIX device to feed data via global shared memory.
Overview
The Solar Status app is a dashboard designed to visualize your real-time photovoltaic data. It packs multiple live indicators into a single 32x8 view.
UI Features
- Dynamic Battery Icon (Left): Draws a custom battery structure pixel-by-pixel. The core fill changes color multi-stage depending on the SOC (Red -> Orange -> Amber -> Green).
- Charge/Discharge Status:
- Charging: A green pulsating lightning bolt indicators flash inside the battery. Hues and saturation adjust fluidly based on the charging wattage.
- Discharging: A flowing line travels downwards inside the battery
- Standby: A dimmed single pixel glows inside the center.
- Centered Yield Display: your current daily generation string.
- PV Live Output Bar (Bottom Row): A customizable golden progress bar mapping your current generation output.
Setup Instructions
-
Install Dependencies First:
- Ensure your MQTT Collector script is running and configured correctly.
-
Install this Script:
- Open your AWTRIX web interface.
- Go to the Scripts tab, create a new script, and name it
solar_status. - Paste the Berry code into the editor and press Save (
Ctrl+S).
-
Configure Data Coupling:
- Open the Apps tab and click the Gear icon next to
Solar Status. - Name of MQTT_Collector: Enter the namespace name of your background collector (Default:
MQTT_Collector). - Match the respective key names for your sensor array values:
PV Battery SOCPV Battery PowerPV today PowerPV current Power
- Open the Apps tab and click the Gear icon next to
-
Fine-Tuning:
- Max. PV Power: Set your plant's custom (W_p) peak value (e.g.,
16000) to scale the bottom progress indicator bar. - Customize layout looks by picking individual hex values for
Text Color,PowerLine Color, and the sub-division dots (PowerLineIndicator Color).
- Max. PV Power: Set your plant's custom (W_p) peak value (e.g.,
Sign in to view and copy the code of this script.
Community
Discussion 0
Ask a question, suggest a change or share how you use it.
No comments yet. Start the conversation.
Have an idea?
Sign in to ask questions and join the conversation.