Icinga Status
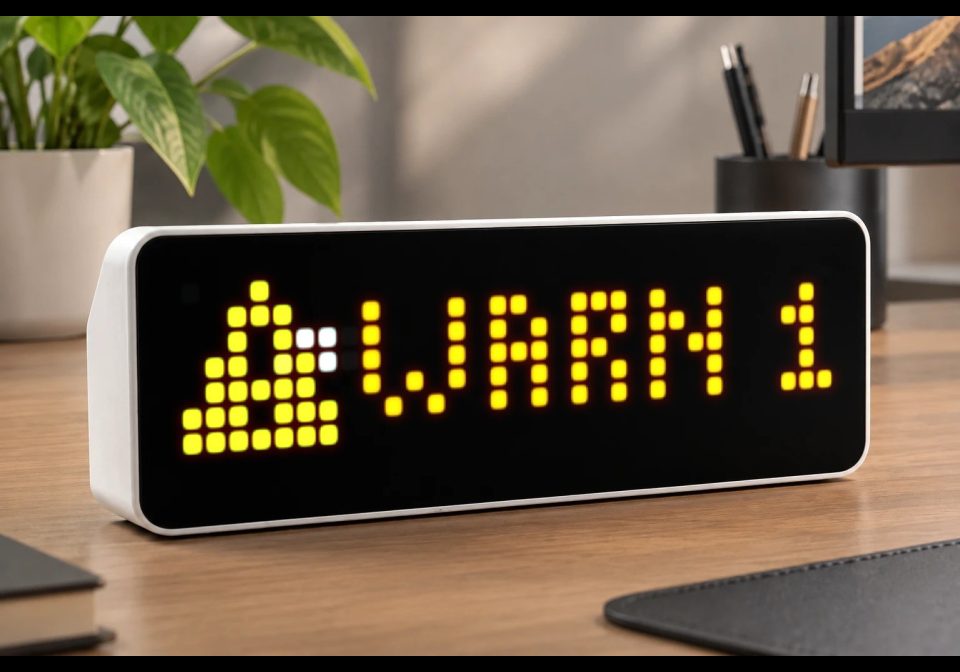
On your display
Shows OK, WARN or CRIT from Icinga
- Works with
- AWTRIX NG
- Topic
- Miscellaneous
- Includes
- Script
Choose your display in the next step.
Flow description
Displays the global Icinga status directly on AWTRIX NG without Home Assistant or MQTT.
The script queries the Icinga 2 CIB status API via HTTPS and displays:
🟢 OK – no host or service problems
🟡 WARN n – warning or unknown services
🔴 CRIT n – down hosts or critical services
Requires an Icinga API user with access to /v1/status/CIB.
HTTP Basic Authentication must be entered as a complete Authorization header:
Basic <base64(username:password)>
Example to generate it on macOS/Linux:
printf '%s' 'username:password' | base64
Recommended LaMetric icons:
649 = OK, 1077 = warning, 555 = critical.
Press the middle/select button to force an immediate refresh.
rbCE6BApDGa2.ax
# @name Icinga Status
# @desc Shows Icinga host/service status as OK, WARN or CRIT
# @author Oli & Nilo
# @version 1.1
# @config url text "Icinga CIB URL" default="https://icinga.example.local:5665/v1/status/CIB"
# @config auth text "Authorization Header" default="" maxlen=256
# @config every number "Refresh" default=60 min=30 max=600 unit=s
# @config icon_ok text "OK Icon" default="649"
# @config icon_warn text "WARN Icon" default="1077"
# @config icon_crit text "CRIT Icon" default="555"

class IcingaStatus
  var state, count, ticks, busy, period, ic, label, color
  var parse_fails

  def init()
    self.state = "WAIT"
    self.count = 0
    self.ticks = 0
    self.busy = false
    self.period = store.get("every")
    self.ic = ""
    self.label = "..."
    self.color = 0x666666
    self.parse_fails = 0
  end

  def on_body(b, st)
    self.busy = false

    # HTTP / connection error
    if b == nil || st != 200
      self.state = "ERROR"
      self.count = st
      self.ic = store.get("icon_crit")
      self.label = "ERR " + str(st)
      self.color = 0xFF0000
      return
    end

    # Extract relevant counters from the Icinga CIB response
    var d = re.search("\"num_hosts_down\":(\\d+)", b)
    var c = re.search("\"num_services_critical\":(\\d+)", b)
    var w = re.search("\"num_services_warning\":(\\d+)", b)
    var u = re.search("\"num_services_unknown\":(\\d+)", b)

    # Response received, but expected CIB values were not found
    if d == nil || c == nil || w == nil || u == nil
      self.parse_fails += 1

      # Keep the last valid display for the first two parse failures
      if self.parse_fails < 3
        return
      end

      # Three consecutive parse failures -> show error
      self.state = "ERROR"
      self.count = 0
      self.ic = store.get("icon_crit")
      self.label = "ERR"
      self.color = 0xFF0000
      return
    end

    # Valid response -> reset parser error counter
    self.parse_fails = 0

    var down = int(num(d[1]))
    var crit = int(num(c[1]))
    var warn = int(num(w[1]))
    var unknown = int(num(u[1]))

    # Host DOWN or service CRITICAL -> CRIT
    if down > 0 || crit > 0
      self.state = "CRIT"
      self.count = down + crit
      self.ic = store.get("icon_crit")
      self.label = "CRIT " + str(self.count)
      self.color = 0xFF0000

    # Service WARNING or UNKNOWN -> WARN
    elif warn > 0 || unknown > 0
      self.state = "WARN"
      self.count = warn + unknown
      self.ic = store.get("icon_warn")
      self.label = "WARN " + str(self.count)
      self.color = 0xFFA500

    # Everything OK
    else
      self.state = "OK"
      self.count = 0
      self.ic = store.get("icon_ok")
      self.label = "OK"
      self.color = 0x00FF00
    end
  end

  def loop()
    if self.ticks <= 0 && !self.busy
      self.ticks = self.period
      self.busy = true

      http.get(
        store.get("url"),
        / b, st -> self.on_body(b, st),
        {
          'headers': {
            'Authorization': store.get("auth"),
            'Accept': "application/json"
          }
        }
      )
    end

    self.ticks -= 1
  end

  def draw()
    clear()

    if self.ic != ""
      icon(self.ic, 0, 0)
    end

    text(8, 6, self.label, self.color)
  end

  def on_button(btn)
    # Manual refresh with the middle/select button
    if btn == "select"
      self.ticks = 0
    end
  end
end

return IcingaStatus()Discussion 0
Ask a question, suggest a change or share how you use it.
No comments yet. Start the conversation.
More flows for AWTRIX NG Scripts or Miscellaneous
Something wrong with this flow? Report it.
Have an idea?
Sign in to ask questions and join the conversation.