EPEX Spot Day-Ahead electricity prices
Use with Home Assistant
EPEX Spot Day-Ahead electricity prices with selectable bidding zone and quarter-hour or hourly timeline
- Topic
- Smarthome
- Includes
- Flow
Runs on
- Runs on 32×8 (TC001 & DIY)
- Does not run on 52×16 (TC002) Made for 32×8 (TC001 & DIY).
- Does not run on 32×8 with AWTRIX 3 (TC001 & DIY) Made for AWTRIX NG.
Flow description
EPEX Energy for AWTRIX NG
A Berry script app for AWTRIX NG LED matrix clocks (Ulanzi TC001 and compatible 32×8 panels) that displays live EPEX Spot Day-Ahead electricity prices from the free Energy Charts API — no API key required.
What it shows
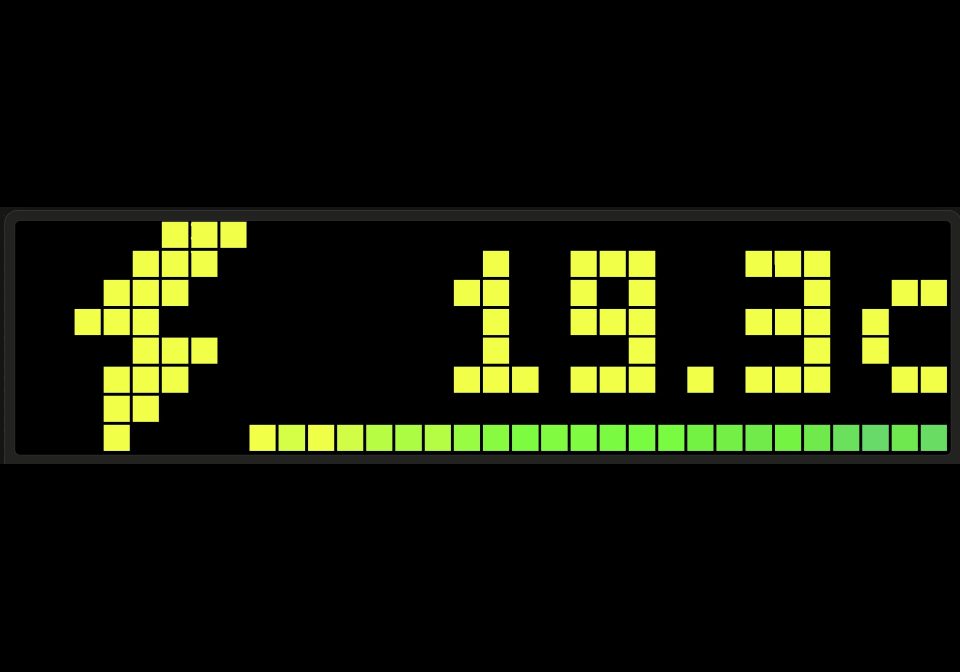
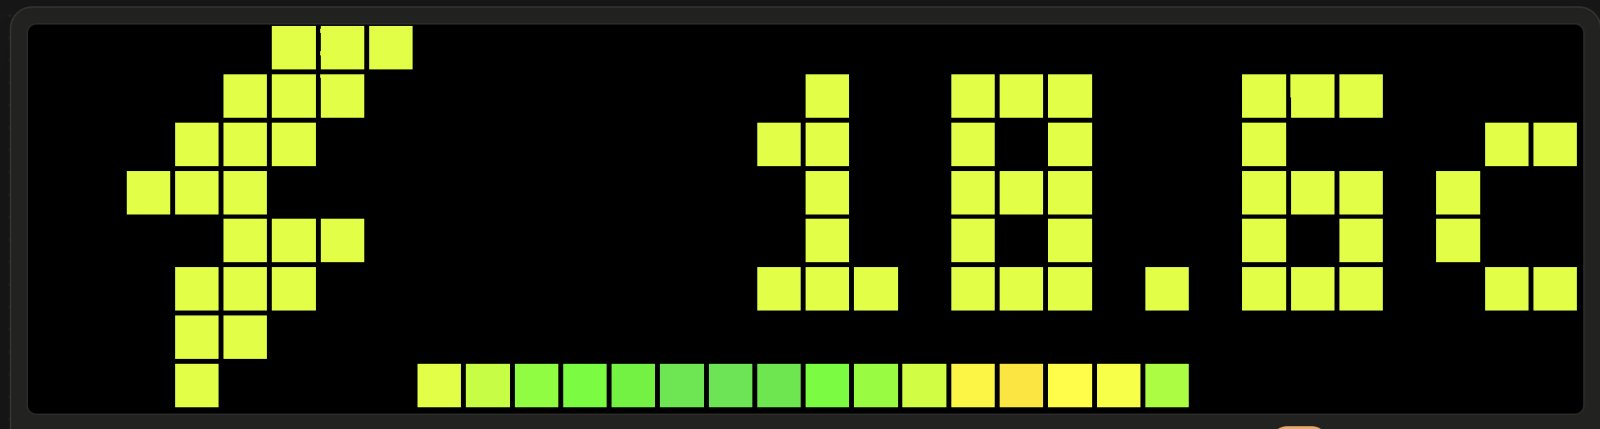
- Top row: current electricity price in euro-cents per kWh (e.g.
19.1c), right-aligned, colored by price level. A lightning bolt icon sits on the left. - Bottom row: a 24-pixel forecast timeline, one pixel per interval, starting at the current interval and extending into the future (including tomorrow's prices once published).
Features
-
Selectable bidding zone — any valid Energy Charts zone:
NL(default),DE-LU,BE,FR,DK1,DK2,AT, and many more. Note: Germany isDE-LU, notDE. -
Two timeline modes:
15min— one pixel per quarter-hour; shows the next 6 hours.hourly— quarter-hour prices averaged per clock hour; shows the current hour plus up to 24 hours ahead.
-
Price gradient — smooth color interpolation with clamped endpoints:
Price (€-ct/kWh) Color ≤ −10 Purple 0 Blue 10 Green 20 Yellow 30 Orange ≥ 40 Red -
Timestamp-aligned data — aligns prices using Unix timestamps from the API, so late-evening views include tomorrow's prices after publication, and DST transitions work correctly.
-
Configurable refresh interval — default 15 minutes (5–60).
-
Error states —
CFG(orange) for an invalid bidding zone,ERR(red) for network/API failures,TIME(orange) when the device clock is not yet set. -
Press the Select button to force an immediate refresh.
Setup
- Copy the flow to your device.
- The app appears in the rotation. Open the Apps tab, click the gear icon on the app's row, and configure:
- Bidding zone (
bzn): your Energy Charts zone code, e.g.NLorDE-LU. - Timeline (
view):15min(6 hours ahead) orhourly(24 hours ahead). - Refresh (
every): polling interval in minutes (default 15).
- Bidding zone (
Notes on data availability
- Tomorrow's day-ahead prices are typically published around 13:00–14:00. Before publication, the forecast bar shows only the remaining intervals of the current day; after publication, the bar fills to its full length on the next refresh.
- An invalid zone code (e.g.
DEinstead ofDE-LU) showsCFGuntil corrected.
Data source
Price data: Energy Charts — license CC BY 4.0, sourced from Bundesnetzagentur / SMARD.de.
Sign in to view and copy the code of this flow.
Discussion 0
Ask a question, suggest a change or share how you use it.
No comments yet. Start the conversation.
More flows for Home Assistant or Smarthome
Something wrong with this flow? Report it.
Have an idea?
Sign in to ask questions and join the conversation.