Frank Energy graph
Use with Home Assistant
Frankenergy graph show
- Topic
- Smarthome
- Includes
- Flow
Runs on
- Does not run on 32×8 (TC001 & DIY) Made for 52×16 (TC002).
- Runs on 52×16 (TC002)
- Does not run on 32×8 with AWTRIX 3 (TC001 & DIY) Made for AWTRIX NG.
Flow description
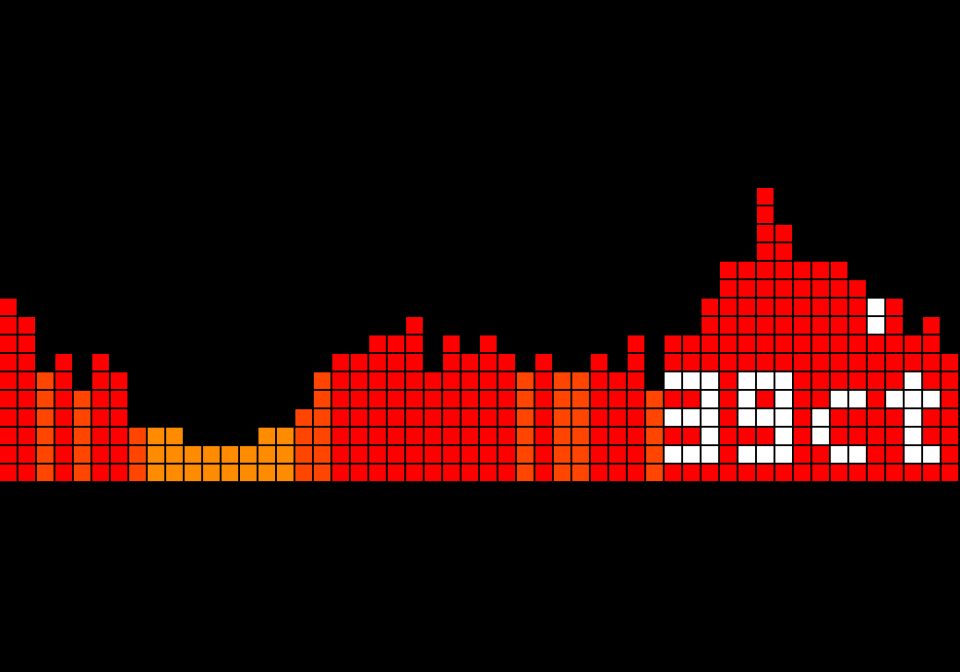
Frankenergy graph shows today’s hourly price wave (Frank Energie) as colored columns on your AWTRIX TC002, with the current quarter-hour marked and the live price bottom right.
Needs: a Frank Energie price sensor in Home Assistant with a prices attribute (today’s quarter-hour prices), and enlargeApps turned off on your TC002 (otherwise the wave renders incorrectly, see the note in the automation).
Colors: cyan/blue = very cheap, green = cheap, orange = average, red = expensive. White dot = where we are right now.
put this in your automations.yaml
Sign in to view and copy the code of this flow.
Discussion 0
Ask a question, suggest a change or share how you use it.
No comments yet. Start the conversation.
More flows for Home Assistant or Smarthome
Something wrong with this flow? Report it.
Have an idea?
Sign in to ask questions and join the conversation.